|
 |
 |
|
|
|
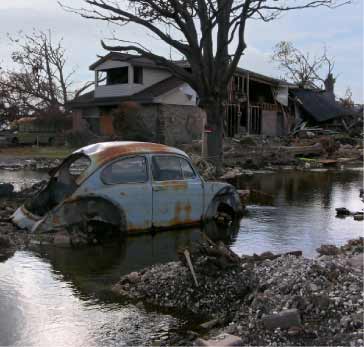 |
New Orleans Louisiana, USA
Climate change has been linked to an increase in extreme weather events, such as storms and hurricanes. In 2005, the city of New Orleans was seriously flooded following Hurricane Katrina. Almost all of its population had to leave, and over 1,000 people were killed. |
| US Energy use (per person, per year) 8.4 tonnes oil equivalent [1] CO2 released per person 21 tonnes [1] |
|
| > More on climate change in New Orleans | |